All Your Fuelling Data
in One Place
At Jigsaw M2M, we offer web solutions to give our clients easy access to all their fuelling data anytime, anywhere. Learn more about our software and how it can ensure smooth fuel management operations in your business.
Game-Changing Fuel Management Software

Our web services cover the basic components of your system: sites, vehicles, and people. We provide efficient software so you can go through all of them without any trouble.
Whether you have one fuelling site or a hundred, our easy-to-use program can be of great help to you. The reports are also pre-configured, so you won’t have to worry about navigating through different settings before running the software.
Our developers have put in a lot of time and effort in perfecting the site for our clients. We made sure that every feature is accessible, labelled properly and is simple to understand.
A Few Clicks Away from the Things You Need

One of the highlights of our web interface is its easy operation. If you’re planning to tweak major functions in your system, you may do so with a click or two from your mouse.
For example, you want to add a new vehicle or sort fuelling operations by specific drivers. You can just click on their respective tabs to view or edit your existing data.
Ultimate User Experience

The Jigsaw M2M software is easy on the eyes because of its bright and colourful interface. It also has built-in page guides which help users navigate through each part of the program in a systematic process.
The software is hosted internally so users won’t have to worry about hardware compatibility, program updates, and data backup. Our website is programmed to fit the requirements of PCs, Macs, tablets and phones, making fuelling information accessible regardless of what device you’re using.
Features Checklist

-
Auto E-Mail Feature for Reports
-
Easy-to-Use Program
-
Pre-configuration/Automation of Reports
-
Integrated Guides in Every Page
-
Quickview Page That Gives an Overview of the Whole Network
-
Real-Time Data Access; No Timed or Manual Polling Required
-
Real-Time Stock Figures That Are Updated After Each Transaction
-
Vision Tiles That Give Real-Time Analysis of Fuel Operations
JigsawFuel Feature Pages
-
Overview
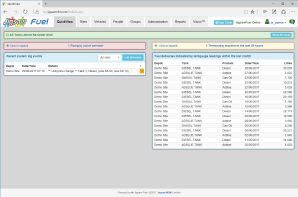
The overview is the first page you’ll see after logging in to our web-based system. It displays the status of all sites, tanks, and pumps. This way, you can do a quick check of your network’s overall performance.
-
Vehicles
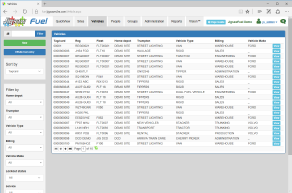
This page displays vehicles and other assets of your business that require the use of fuel. You may add and edit autos, or see the latest fuelling event for certain assets.
-
Groups
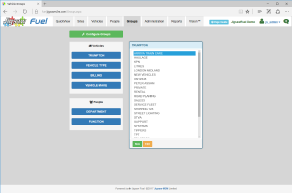
Whether they’re groups for vehicles or staffing, you can tweak your options on this page. This way, you can choose clusters that are essential in your day-to-day business operations and generate relevant and informative results.
-
Reports
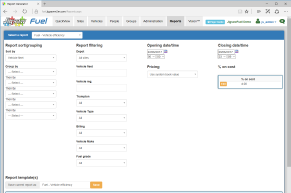
Our system has a wide selection of comprehensive report templates that can be tweaked to fit your company’s requirements. You can save the pre-configured documents as PDF or excel files, and choose to have it emailed automatically.
-
Sites

This page displays live data of each site’s fuel stocks and transactions. A colour-coding system is also used to show the status of pumps and tanks in the fields.
-
People
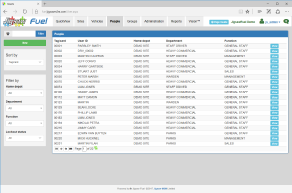
On this part of the software, users are allowed to see lists of people who are authorized to draw fuel from sites. You may add names, edit details, and see the latest fuelling events by simply clicking on the entries.
-
Administration
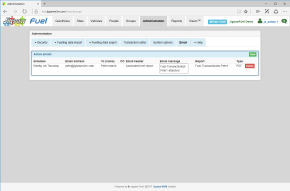
This page allows users to access background tasks needed in every fuel management system. They can change passwords, import and export fuelling data, set up automated emails, sort people into groups, and more.
Jigsaw Vision Tiles
The Vision tab feature gives every user free access to analysis tools that you can use to monitor the performance of your business. Each tile displays information about your fleet, stock holdings, and unusual fuelling events or underperforming vehicles. While additional tiles can be added, here are some of the popular ones:
-
Stock Holding
This displays the stock holdings of a specific or all fuelling sites. It also contains the total cost price as well as the current ullage.
-
Highest Fuel Usage by Vehicle
This tile highlights the excessive use of yard key or any vehicle that consumes excessive fuel.
-
Fuel Purchase Price
On this page, users will see the prices of fuel on each site in the network. This data will be used to compare the gate price in the National Average Refinery.
-
Vehicle Efficiency
The page displays a colour-coded view of fleets. Vehicles with the same colour are grouped together to easily see which are faring differently compared to others.
-
Ad Blu Usage.
This tab is used to directly compare Ad Blu and Diesel usage among the vehicles in fleets.


